 4 weeks ago
12
4 weeks ago
12
Key Notes
- Whale wallet offloaded 600 billion PEPE to Binance, capping a $3.5M loss.
- PEPE is currently trading around $0.00001008, down by 4% in the past day.
- The meme coin is testing key support, with potential for a breakout to $0.00002123.
PEPE is currently trading at around $0.00001008, down more than 22% in the past week. The sharp decline has wiped out over $1.3 billion from its market cap, now sitting at $4.24 billion.
The downturn aligns with the broader crypto market pullback, as investors scale back exposure to risk assets amid rising geopolitical tensions.
What Happened to PEPE Price
On-chain data from LookOnChain confirms a major profit-taking move by whale 0x6ea4. It deposited the last of its 600 billion PEPE tokens—worth around $6.04 million—onto Binance on Wednesday.
PEPE whale 0x6ea4 deposited the last 600B $PEPE($6.04M) to #Binance 50 minutes ago.
A month ago, the whale withdrew 2.2T $PEPE ($27.64M) from Binance, and has since deposited it back in three batches—on June 8, June 13, and June 18—taking an estimated loss of ~$3.5M.… pic.twitter.com/Y9i6HjAeS0
— Lookonchain (@lookonchain) June 18, 2025
This comes after the same wallet withdrew 2.2 trillion PEPE (then valued at $27.64 million) last month, only to deposit them back in three separate batches. Analysts estimate the whale may have taken a loss of around $3.5 million across these trades.
Large CEX deposits following price rallies often result in potential sell pressure, and that pattern appears to be playing out.
Despite this, not all whales are selling the third-largest meme coin. On Tuesday, a newly created wallet withdrew 500.6 billion PEPE—worth roughly $5.2 million—from Binance, suggesting that many long-term players still see value at current levels.
Moreover, Coinglass data reveals that PEPE open interest jumped 7% in the past day, reaching $526 million at the time of writing. This indicates that futures traders are still placing big bets on the meme coin’s price action.
PEPE Price Outlook
On the daily chart, the RSI stands at 37.76, nearing the oversold threshold. This suggests bearish momentum is high, but a reversal could be on the horizon if buyers step in.
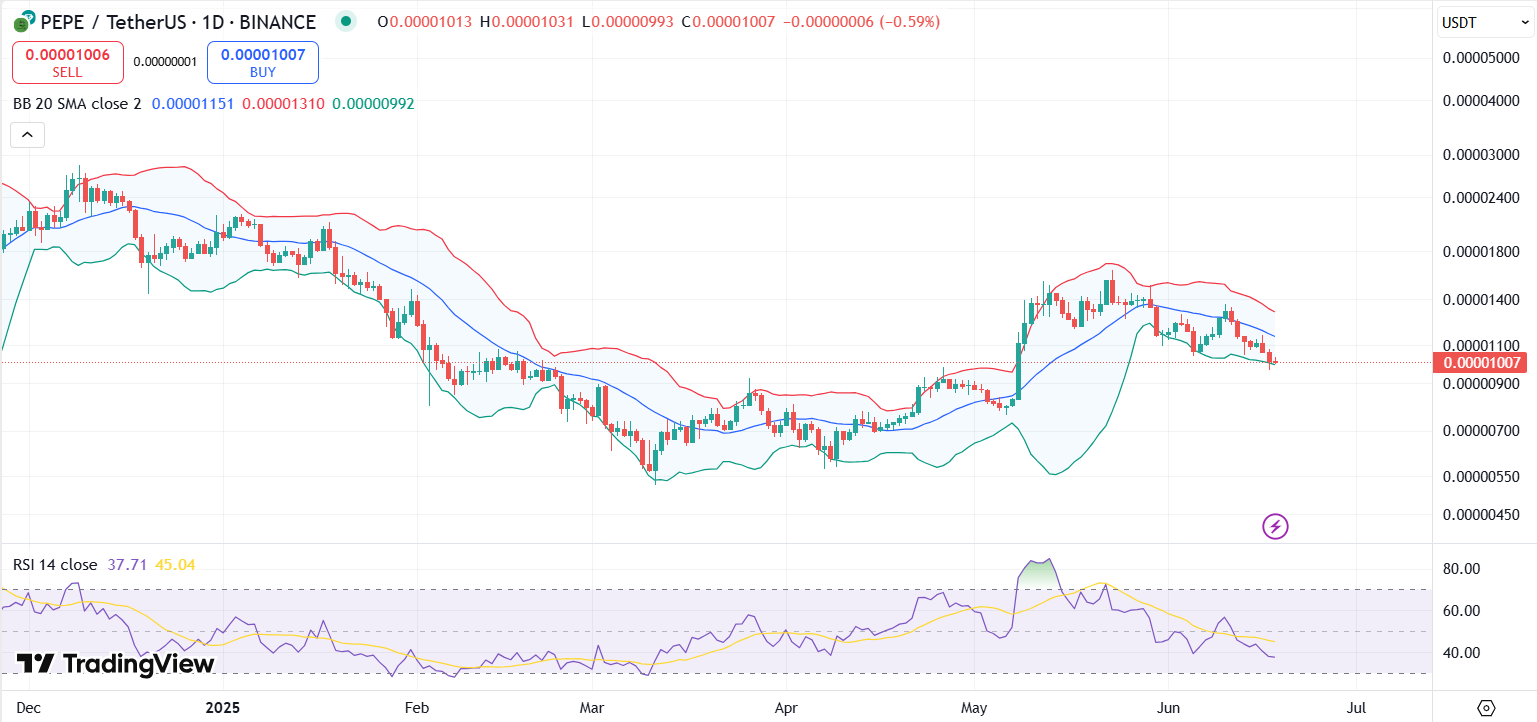
PEPE chart with RSI and Bollinger Bands | Source: Trading View
Bollinger Bands show PEPE touching the lower band around $0.00000980, which is active as a dynamic support. If the crypto holds this level, a potential short-term bounce toward $0.00001300 could happen soon.
Meanwhile, MACD continues to trend bearish, with the MACD line below the signal line and red bars on the histogram. A breakdown below $0.00000950 could lead to further downside in the short-term.
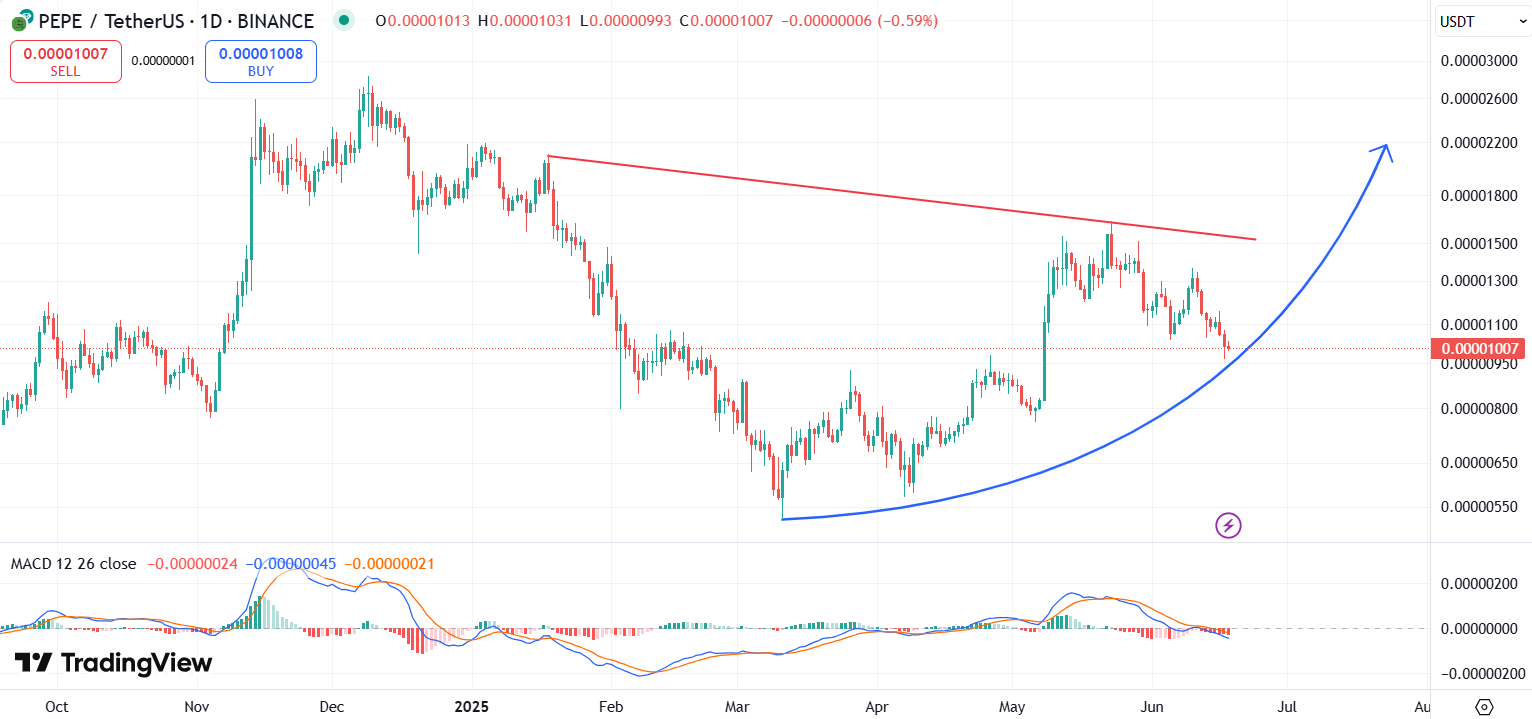
PEPE chart with MACD and descending broadening wedge pattern | Source: Trading View
Interestingly, PEPE appears to be forming a descending broadening wedge on the daily chart since March 11—a typically bullish reversal pattern. The cryptocurrency is currently testing the lower curve of this wedge, which often results in a parabolic breakout.
Analysts expect that if PEPE confirms the pattern, a price target as high as $0.00002123 is achievable.
Disclaimer: Coinspeaker is committed to providing unbiased and transparent reporting. This article aims to deliver accurate and timely information but should not be taken as financial or investment advice. Since market conditions can change rapidly, we encourage you to verify information on your own and consult with a professional before making any decisions based on this content.
Pepe News, Cryptocurrency News, News

A crypto journalist with over 5 years of experience in the industry, Parth has worked with major media outlets in the crypto and finance world, gathering experience and expertise in the space after surviving bear and bull markets over the years. Parth is also an author of 4 self-published books.


 English (US) ·