
 3 weeks ago
11
3 weeks ago
11
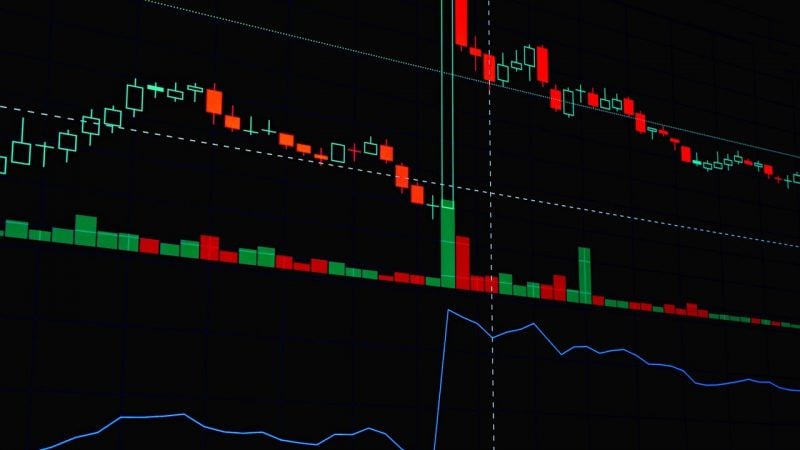
The S&P 500 might look fine from the outside. Look under the hood and the picture is considerably less reassuring. Market breadth, the measure of how many individual stocks are actually participating in a market move, has weakened sharply in September. As of September 8, only 42.34% of S&P 500 components were trading above their 50-day moving average, the lowest reading in five months and a notable slide from levels above 60% seen earlier in the summer. It got worse from there. By September 18, just 31.4% of US equities were trading above their 50-day moving average. The 200-day reading, which tracks longer-term trend participation, fell to 43.2%, down from peaks near 70% only weeks prior. What the numbers actually mean When fewer than a third of S&P 500 stocks can clear that bar, it means the index’s headline number is being held up by a shrinking group of names, while the majority are quietly losing ground. By September 15, the internal picture was even more stark. Some 38.5% of S&P 500 stocks were trading below both their 50-day and 200-day moving averages simultaneously, outnumbering the 32.3% that remained above both lines. Why breadth matters more than the ind...
Related
Qivalis receives EMI authorization from Dutch central bank f...
13 minutes ago
0
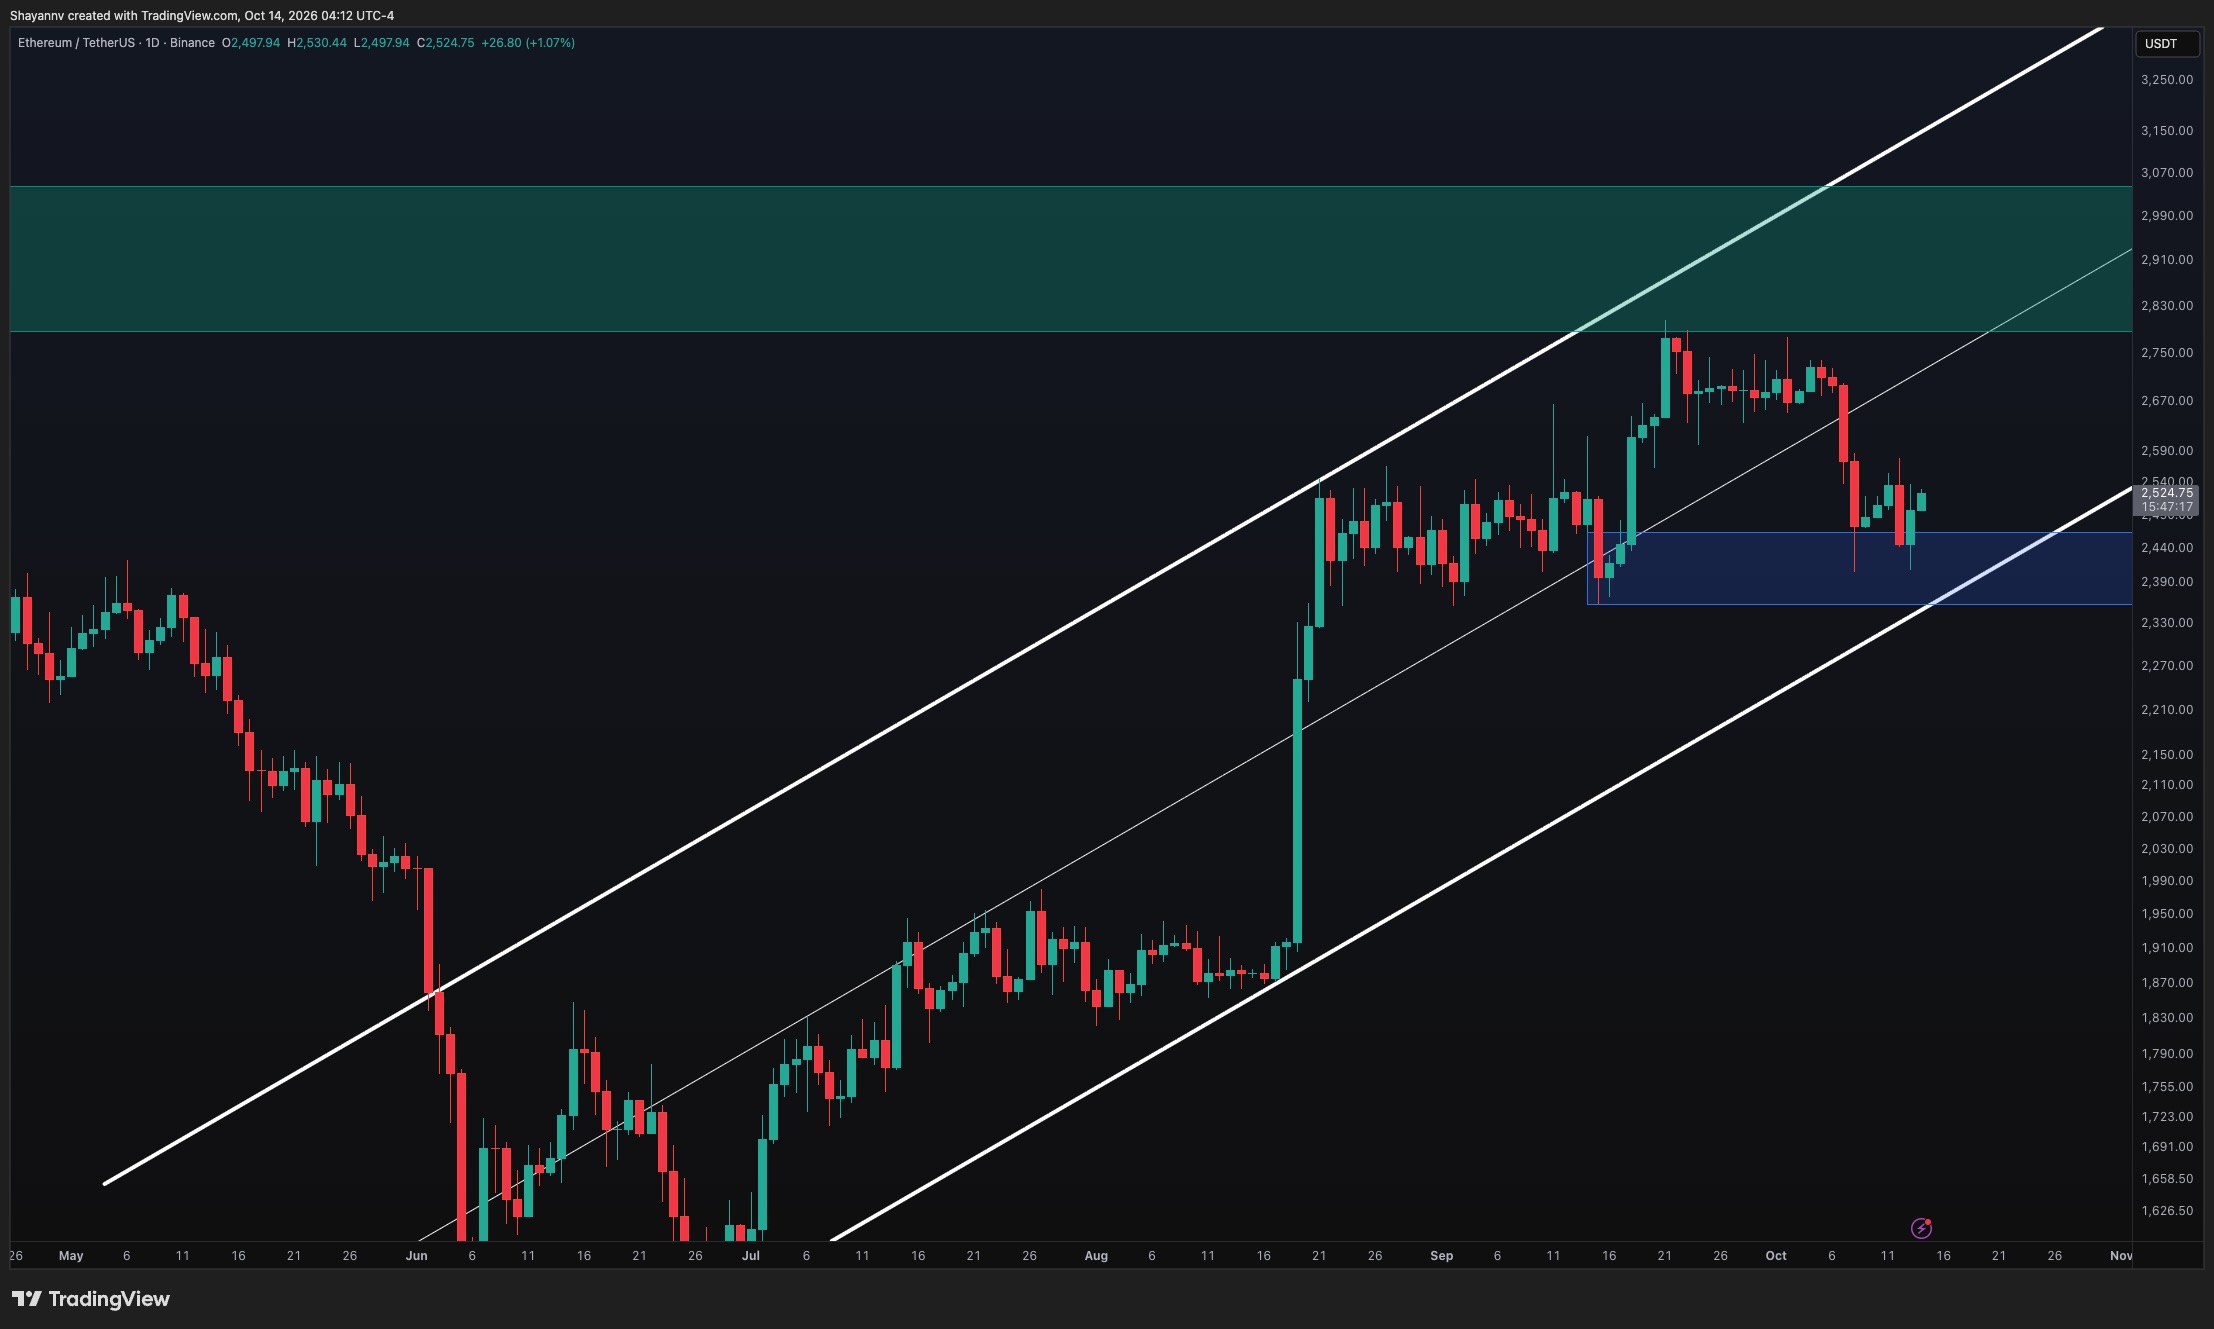
Ethereum Price Analysis: What’s the Worst-Case Scenario if E...
16 minutes ago
0
Bitcoin Price Plunges as September CPI Comes Out Higher Than...
31 minutes ago
0
What is a hardware wallet? How the device protects your keys...
36 minutes ago
0

Kraken parent to buy Lithuanian Saldo Bank amid TradFi expan...
41 minutes ago
0

Anthropic report finds robots can handle 74% of US physical ...
46 minutes ago
0
Evernorth taps Ripple, Kraken, Coinbase and BitGo to put its...
46 minutes ago
0

Solana ETF in Hong Kong at 0.6 percent: what changes for Eur...
47 minutes ago
0
Popular

Cardano Jumps 11 Percent: What ADA Holders Should Check Befo...
3 weeks ago
106


Bitcoin price tops $77K after BOJ lifts rates to 1.25%
3 weeks ago
75

Bitcoin price rebound faces major test at $83K
3 weeks ago
70



XRP logo lands on Louisville basketball court
4 weeks ago
63
 English (US) ·
 © Clint's Cryto News 2026. All rights are reserved
